The Package Pandamonium
With thousands of packages to choose from in a constantly changing landscape, choosing the right R package can often feel pretty dizzying.
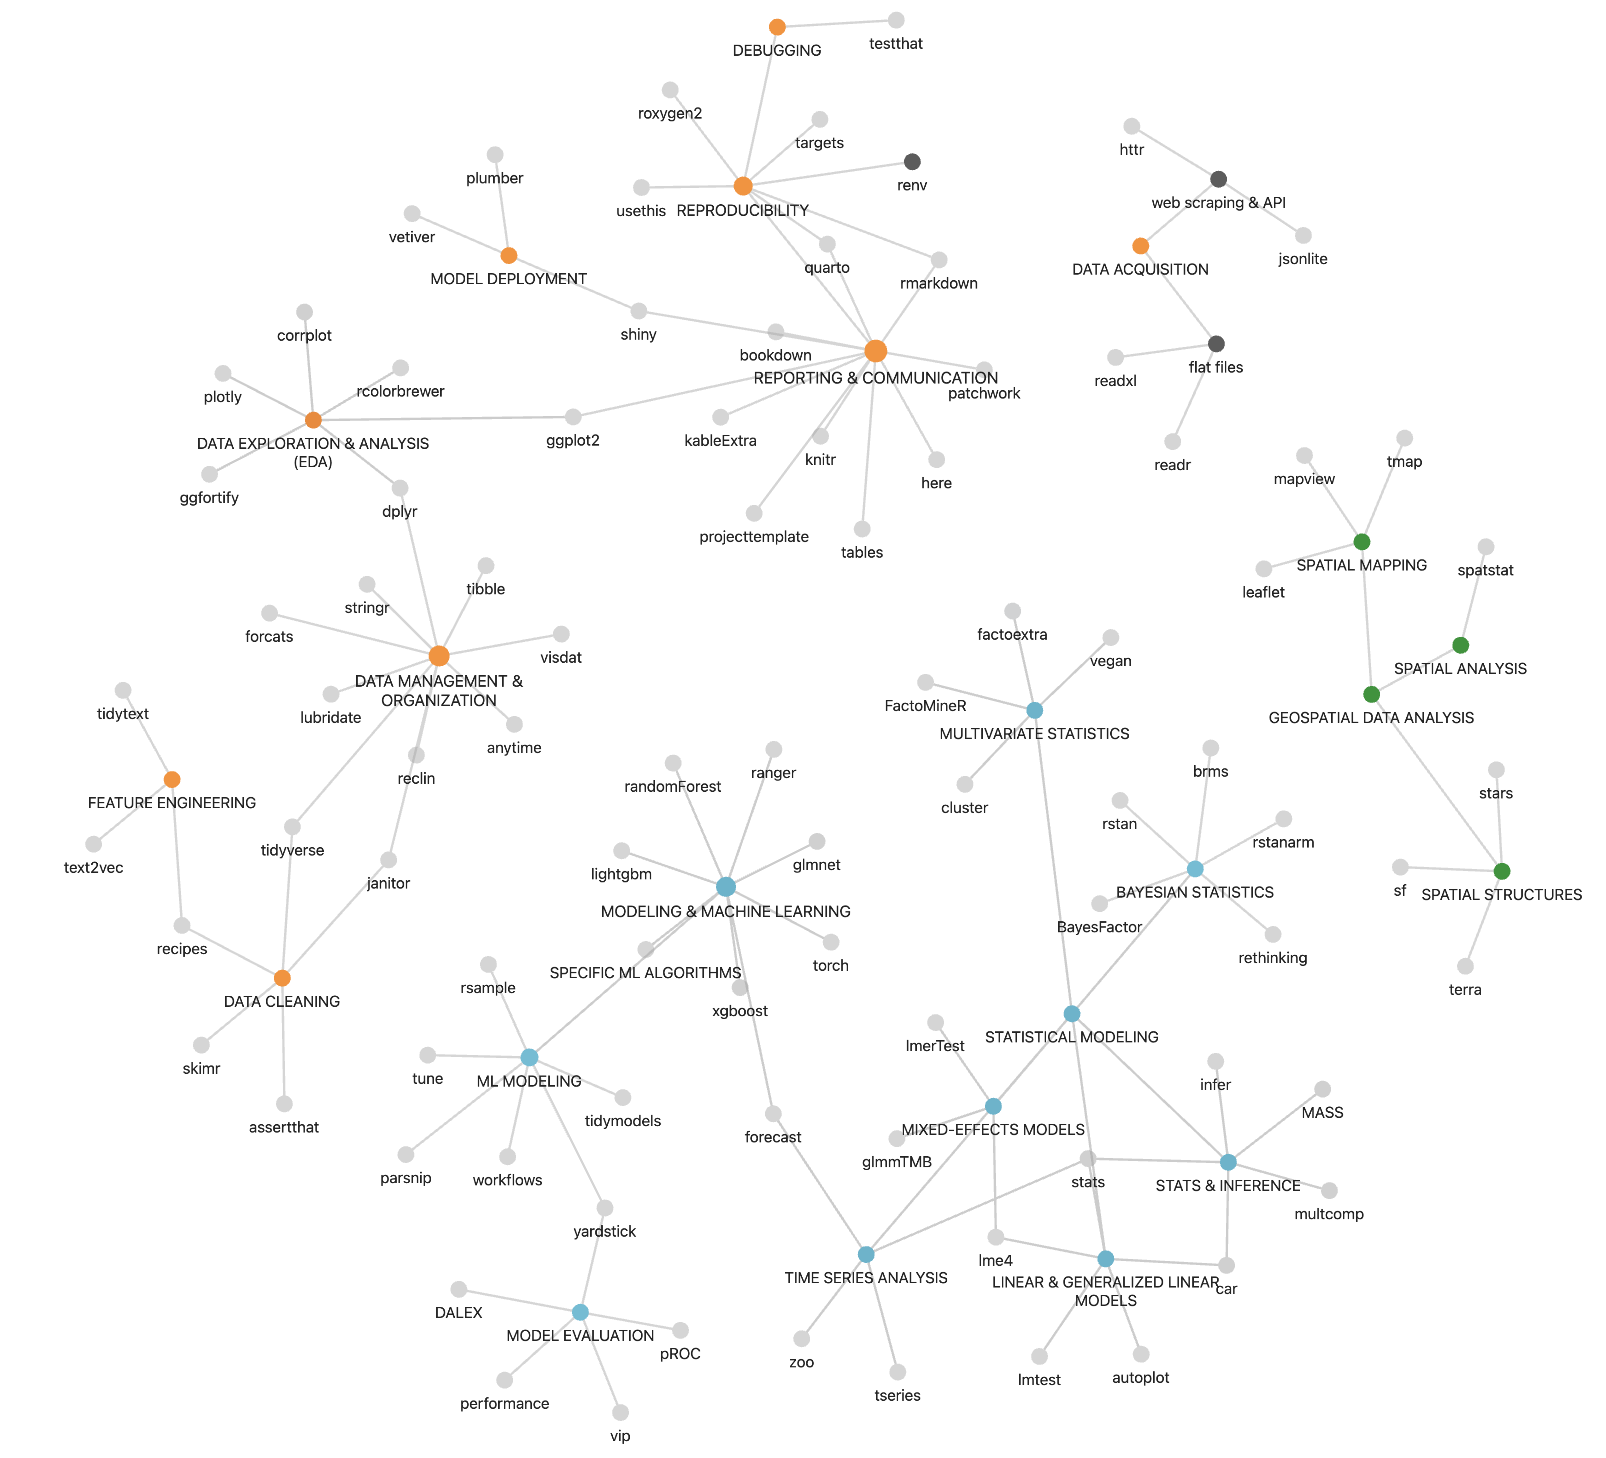
To make sense and help navigate the complexity of this rich “toolbox-ecosystem”, I’ve created a static network diagram that organizes some of the common data science and analytics themes that I encounter frequently, and packages that support them. There are parts of the diagram that are more familiar to me, and others less so, but I’ve tried to capture some of the most used and popular packages for those purposes as well.
Complexity of Choice
From geospatial analysis to statistical modeling, data cleaning to machine learning, the R ecosystem offers a package for nearly every data science need. My network diagram is a snapshot of this complexity to form a web of interconnected nodes representing different domains and the packages that power them, and I’ll likely update & iterate upon this diagram over time as I come by new packages or remember familiar ones.
Important
This is NOT a comprehensive map! It’s a personal journey through the R ecosystem, capturing packages and connections that have crossed my path. This is a curated snapshot, not an exhaustive catalog (although a catalog would be pretty awesome).
Note
Another note :) This visualization, with a slight bias towards geospatial analysis, reflects my path and interests in data science. If you made one too, it probably would look a bit different.
From Data Acquisition to Data Communication
The orange nodes of the network diagram captures the data science workflow before and after modeling. The green nodes highlight some packages associated with geospatial data analysis.
Data Acquisition
Packages like httr, jsonlite, and readxl enable data retrieval from diverse sources, bridging the gap between information and analysis.
Data Cleaning & Management
Tools like tidyr, janitor, and recipes help clean and prepare data, ensuring quality and reliability before deeper analysis.
Exploration & Analysis
The dplyr and ggplot2 ecosystem forms the core of data manipulation and visualization. These packages allow data scientists to explore, understand, and communicate data narratives effectively.
Reporting & Communication
Packages such as quarto, bookdown, and rmarkdown setup different styles and platforms for data communication ranging from blogposts (like this one), digital textbooks, customizable documents, and presentations.
Machine Learning and Statistical Modeling
The blue nodes of the diagram highlights packages related to statistical modeling and machine learning.
Machine Learning
From randomForest to torch, this cluster showcases R’s powerful machine learning capabilities. Packages like tidymodels provide structured approaches to model building and evaluation.
Statistical Modeling
Clusters of statistical packages demonstrate R’s analytical depth. From BayesFactor to linear models, these tools offer robust methods for understanding complex data relationships. Specialized clusters like brms, `vegan`, factoextra and lme4, highlight some statistical methodologies available in R.
Last thoughts & what’s next?
By organizing my mental map of the R landscape and putting it on digital paper, this project serves as my future reference guide, as well as a motivation to reflect on the various packages I’ve encountered over the years. I also wanted to share this diagram with the world since I couldn’t really find any resources like this one on the internet and would’ve appreciated one earlier!
Also, this idea is still seedling. I would love to expand on this project and create a dynamic diagram. In a future iteration, I can imagine the following things:
- Clicking into each node and checking out the summary and resources associated with the package or method
Dragging around & collapsing/expanding nodes to reorganize them
Organizing packages based on popularity or newness
Highlighting package dependencies
A Python version?
…. and more!
Happy package perusing!
Citation
BibTeX citation:
@online{hamilton2025,
  author = {Hamilton, Flora},
  title = {Graphing the {R} {Package} {Landscape}},
  date = {2025-11-26},
  url = {https://floraham.github.io/Projects/2025-11-26-r-packages-diagram/},
  langid = {en}
}
For attribution, please cite this work as:
Hamilton, Flora. 2025. “Graphing the R Package Landscape.”
November 26, 2025. https://floraham.github.io/Projects/2025-11-26-r-packages-diagram/.